
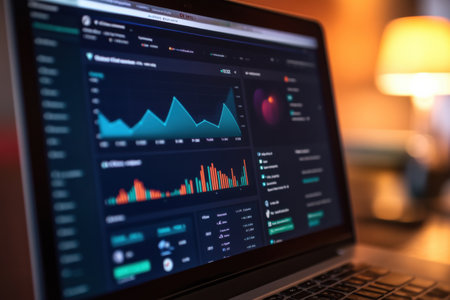
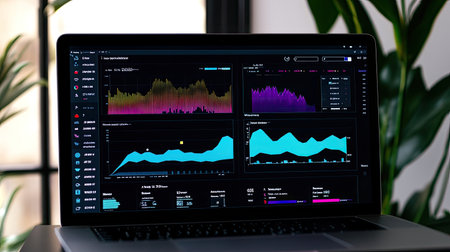
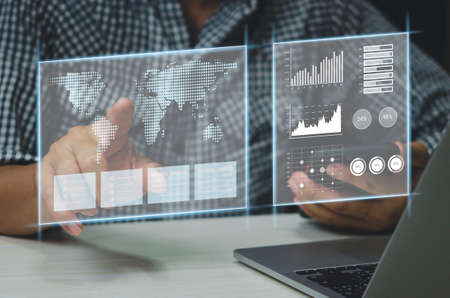
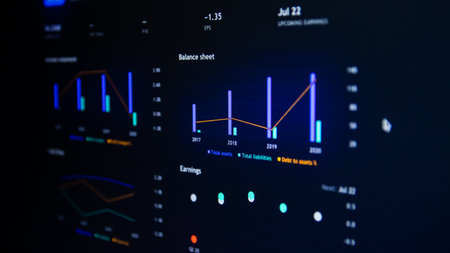
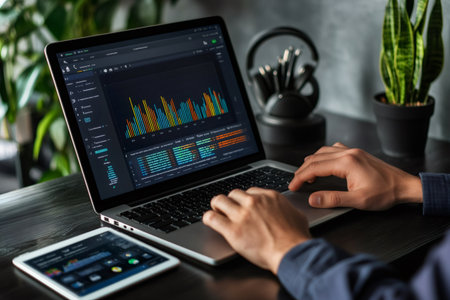
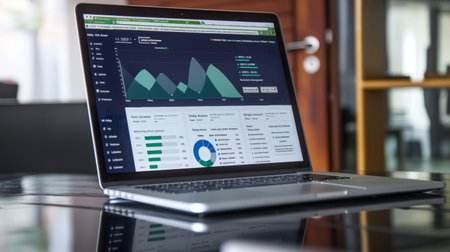
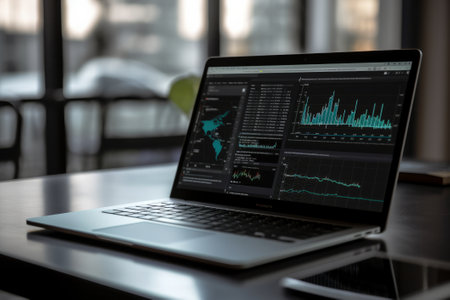
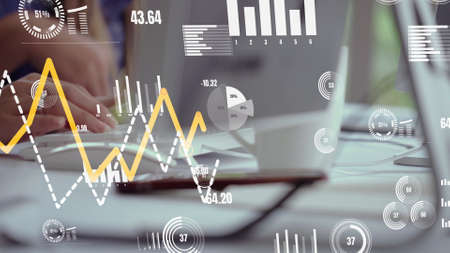
Graphs and charts representing financial metrics and trends are shown on a sleek laptop in a warmly lit room during the evening.
Коллекция по умолчанию
Коллекция по умолчанию
Создать новую
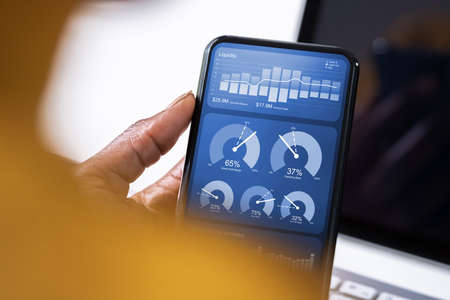
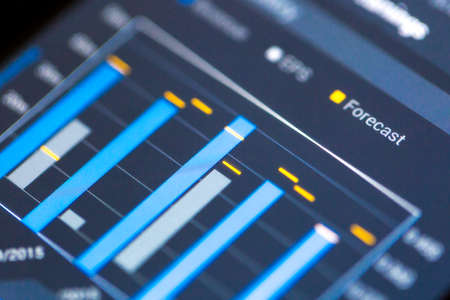
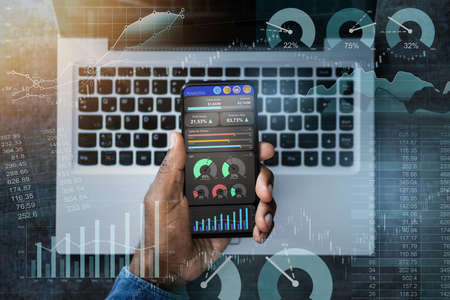
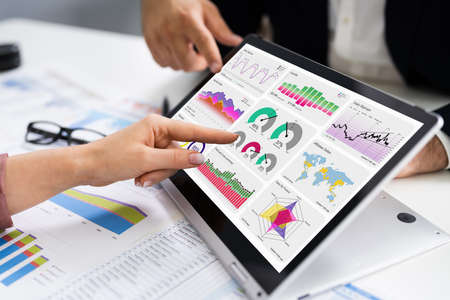
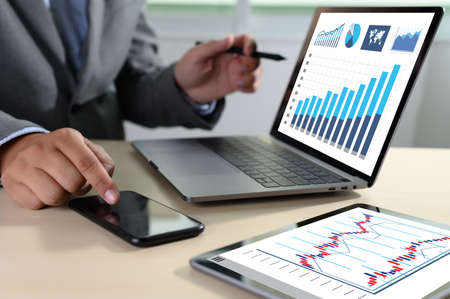
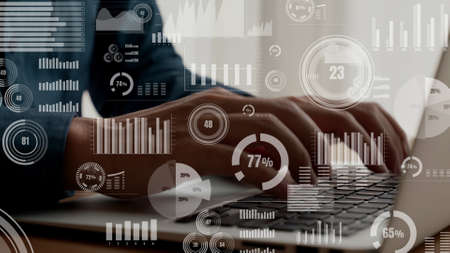
African Advisor Using KPI Dashboard With Financial Analytics Graphs
Коллекция по умолчанию
Коллекция по умолчанию
Создать новую
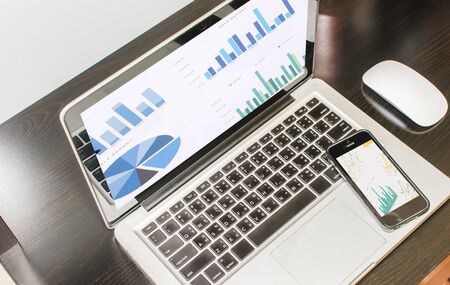
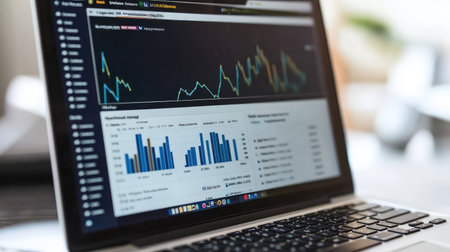
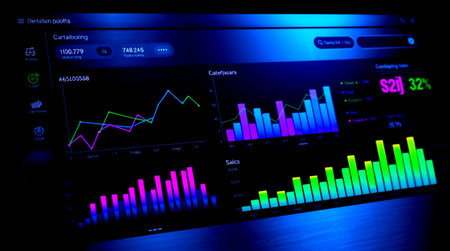
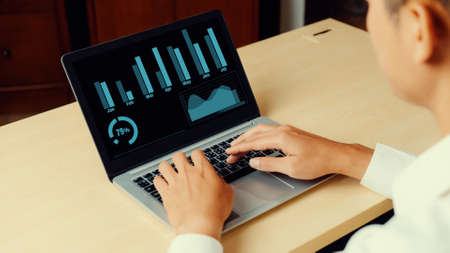
business analyzing graphs on laptop
Коллекция по умолчанию
Коллекция по умолчанию
Создать новую
Apple Computers website. Apple Computers is an American multinational technology company headquartered in Cupertino, California.
Коллекция по умолчанию
Коллекция по умолчанию
Создать новую
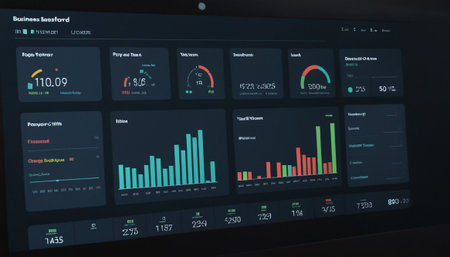
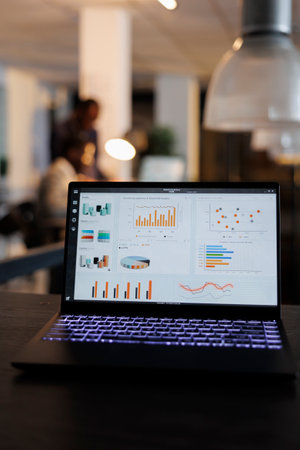
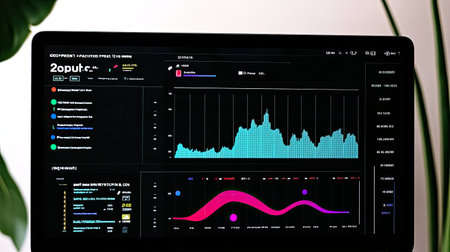
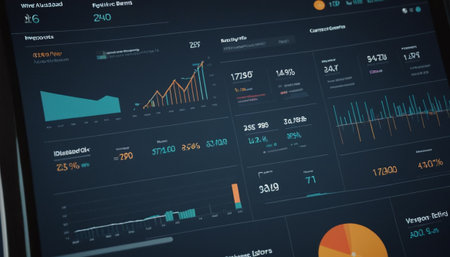
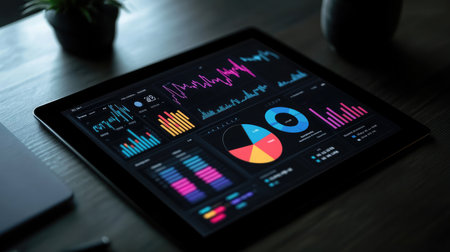
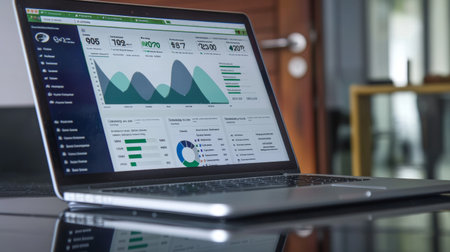
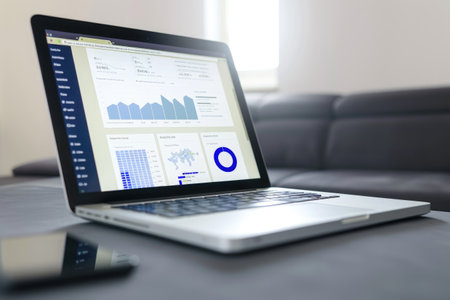
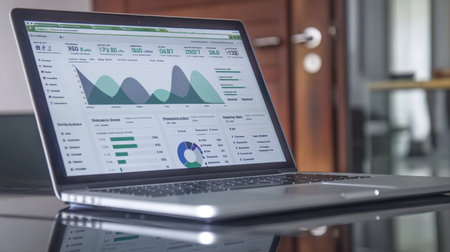
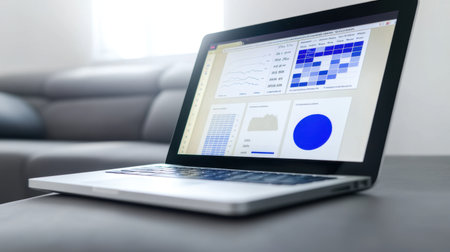
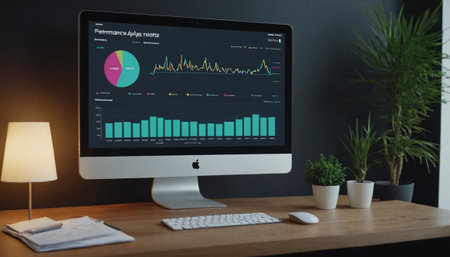
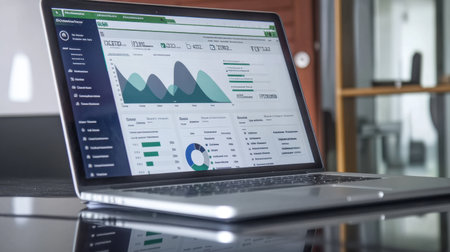
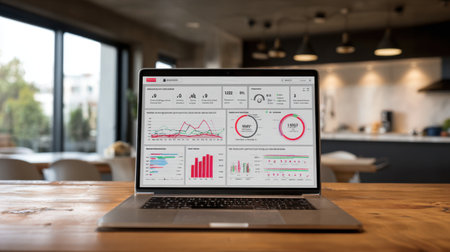
A sleek laptop shows a modern digital dashboard with colorful data visualizations and analytics, set in a contemporary workspace, perfect for business insights.
Коллекция по умолчанию
Коллекция по умолчанию
Создать новую
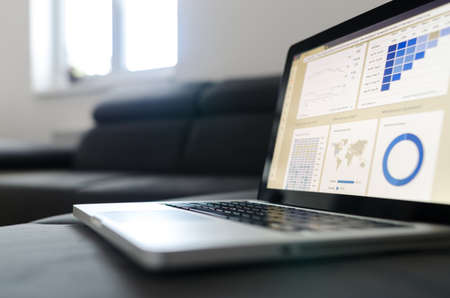
Notebook work with statistics on sofa business
Коллекция по умолчанию
Коллекция по умолчанию
Создать новую
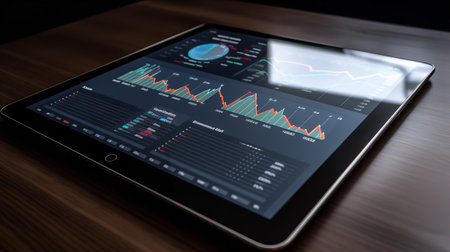
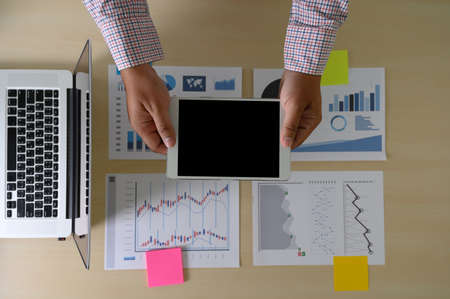
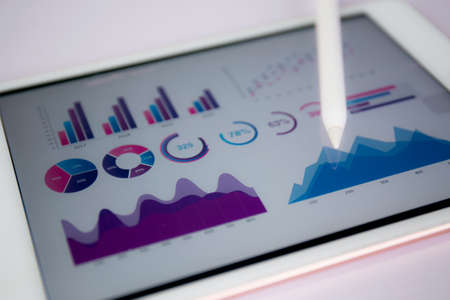
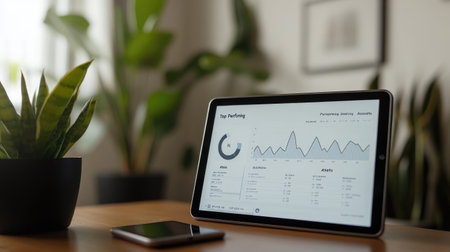
A close-up of graphs and charts displayed on a touch screen tablet, representing data analysis in business operations.
Коллекция по умолчанию
Коллекция по умолчанию
Создать новую
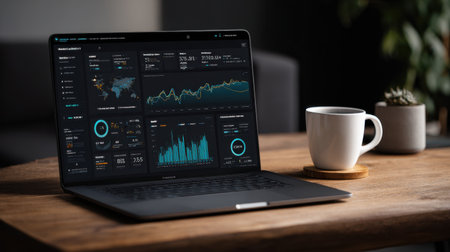
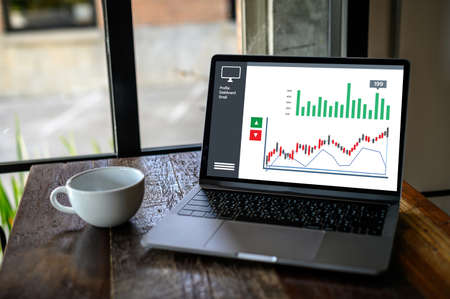
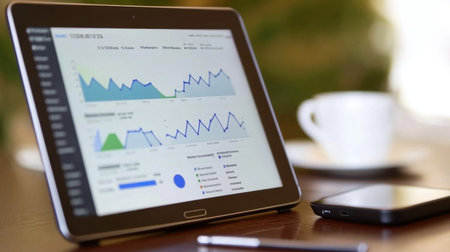
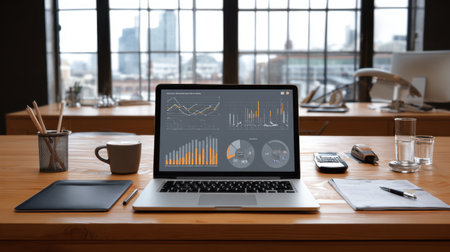
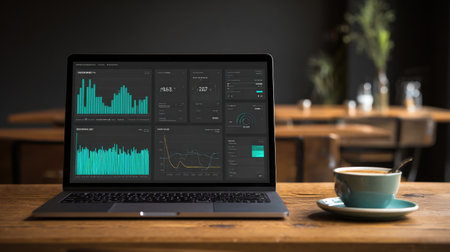
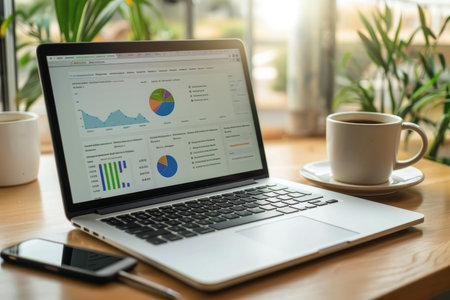
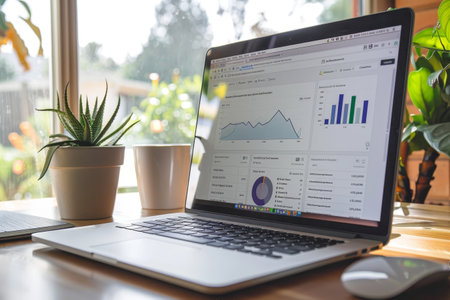
A modern laptop displaying insightful data analytics sits on a wooden table alongside a steaming cup of coffee, creating a cozy and productive workspace atmosphere.
Коллекция по умолчанию
Коллекция по умолчанию
Создать новую
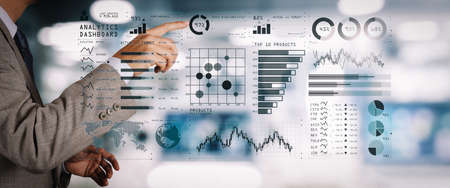
Businessman finger touch virtual screen graph and chart.
Коллекция по умолчанию
Коллекция по умолчанию
Создать новую
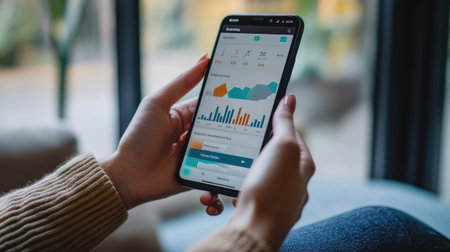
Business and trading finance contept. Stock exchange market chart view on smart phone screen.
Коллекция по умолчанию
Коллекция по умолчанию
Создать новую
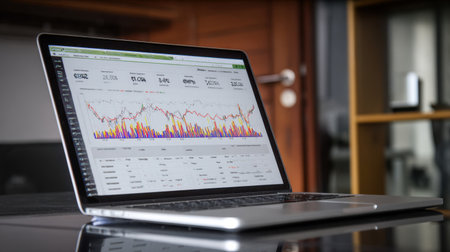
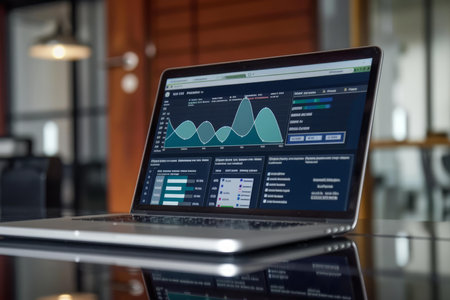
Close-up view of a laptop displaying data analysis with charts and graphs, perfect for showcasing technology, finance, or business analytics themes.
Коллекция по умолчанию
Коллекция по умолчанию
Создать новую

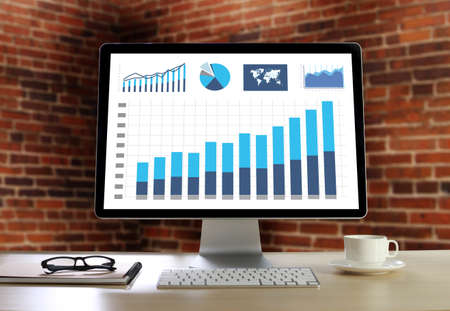
Laptop with Business Analytics Charts and Graphs on Screen
Коллекция по умолчанию
Коллекция по умолчанию
Создать новую
Laptop computer with marketing statistics graphs on screen, standing on table in startup office, coworkers discussing company strategy in background. Employees working overtime in startup office
Коллекция по умолчанию
Коллекция по умолчанию
Создать новую
Stock market data on monitor. Business financial graph on monitor screen. Stock market data on monitor. Business financial graph on monitor.
Коллекция по умолчанию
Коллекция по умолчанию
Создать новую
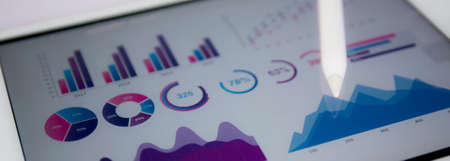
A sleek digital dashboard showcasing market analysis with engaging charts. Ideal for professionals seeking insights into financial performance and trends.
Коллекция по умолчанию
Коллекция по умолчанию
Создать новую

Sales profit numbers changing on monitor after global trade, real time exchange market stocks statistics growing. Financial graphs showing money trend, risk buying. Close up. Tripod shot.
Коллекция по умолчанию
Коллекция по умолчанию
Создать новую
Financial KPI Data Profits Dashboard On Computer
Коллекция по умолчанию
Коллекция по умолчанию
Создать новую
Futuristic dashboard with financial data on a dark background. The concept of business analysis and planning.
Коллекция по умолчанию
Коллекция по умолчанию
Создать новую
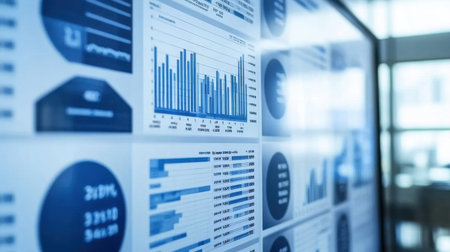
Close-up of graphs and charts on computer screen. Business concept
Коллекция по умолчанию
Коллекция по умолчанию
Создать новую
Celebration background with serpentine and confetti. Vector illustration.
Коллекция по умолчанию
Коллекция по умолчанию
Создать новую
work hard Data Analytics Statistics Information Business Technology
Коллекция по умолчанию
Коллекция по умолчанию
Создать новую
business performance metrics and sales data on a laptop for strategic decision-making
Коллекция по умолчанию
Коллекция по умолчанию
Создать новую
A tablet displaying a pie chart with various investment categories, emphasizing diversification in financial planning
Коллекция по умолчанию
Коллекция по умолчанию
Создать новую
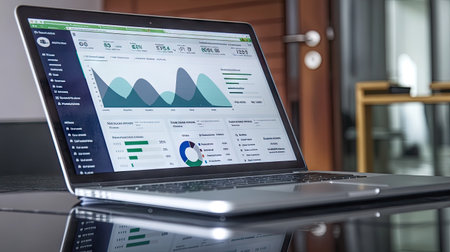
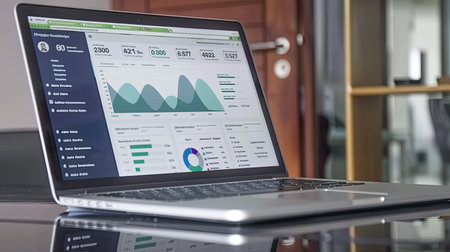
This image showcases a modern laptop displaying detailed business analytics and data visualizations, set in a contemporary office environment.
Коллекция по умолчанию
Коллекция по умолчанию
Создать новую
Laptop computer on glass table
Коллекция по умолчанию
Коллекция по умолчанию
Создать новую
KPI Dashboard Data Analytics On Business Laptop
Коллекция по умолчанию
Коллекция по умолчанию
Создать новую
research stock market chart paper for analysis Brainstorm Meeting research
Коллекция по умолчанию
Коллекция по умолчанию
Создать новую

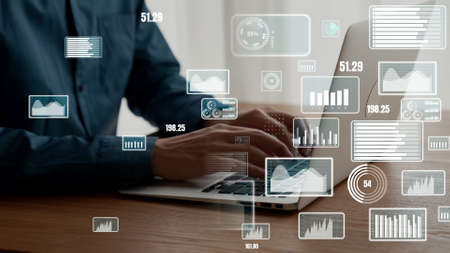
Creative visual of business data analyzing technology . Concept of digital data for marketing analysis and investment decision making .
Коллекция по умолчанию
Коллекция по умолчанию
Создать новую
Report graph and chart of investment with finance on tablet computer on desk, datum of stock and growth, planning and statistic with economic, no people, digital marketing, business concept.
Коллекция по умолчанию
Коллекция по умолчанию
Создать новую
This image features a tablet showcasing financial graphs and charts, set on a desk beside a smartphone and coffee cup, offering an ideal visual for business analytics.
Коллекция по умолчанию
Коллекция по умолчанию
Создать новую
A laptop showing business analytics, charts, and performance metrics, symbolizing financial analysis, technology, and corporate decision-making in a modern environment.
Коллекция по умолчанию
Коллекция по умолчанию
Создать новую
Online Marketing Charts Over Business Meeting Background. Businessman Working On Laptop Analyzing E-Business Internet Traffic Graphs And Promoting Web Content Sitting In Office. Collage
Коллекция по умолчанию
Коллекция по умолчанию
Создать новую
Stock market chart on LED display, stock market data analysis concept.
Коллекция по умолчанию
Коллекция по умолчанию
Создать новую
Report graph and chart of investment with finance on tablet computer on desk, datum of stock and growth, planning and statistic with economic, no people, digital marketing, business concept.
Коллекция по умолчанию
Коллекция по умолчанию
Создать новую
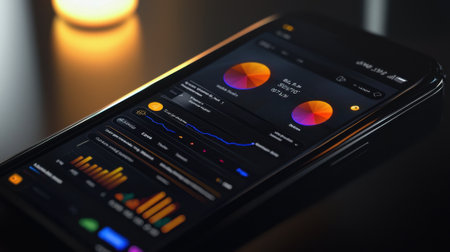
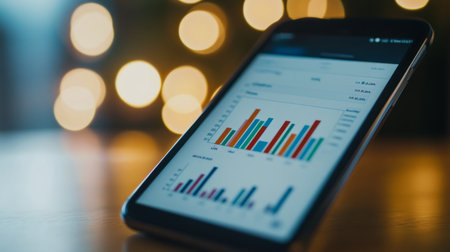
A sleek smartphone shows vibrant data charts and graphs against a dark background. The device captures attention with its user-friendly interface and illuminated ambiance.
Коллекция по умолчанию
Коллекция по умолчанию
Создать новую
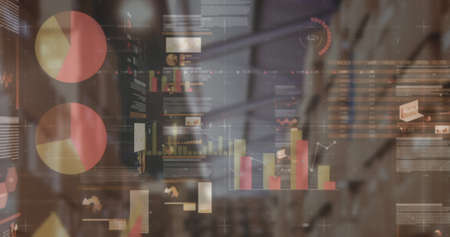
Image of financial data processing over empty warehouse. global shipping, delivery and connections concept digitally generated image.
Коллекция по умолчанию
Коллекция по умолчанию
Создать новую

Low angle camera shot of african american employee alone at work, enjoying music while checking financial data charts on computer. Bookkeeper with headphones on working in office during nightshift
Коллекция по умолчанию
Коллекция по умолчанию
Создать новую
close-up of a personal computer screen. Business background
Коллекция по умолчанию
Коллекция по умолчанию
Создать новую
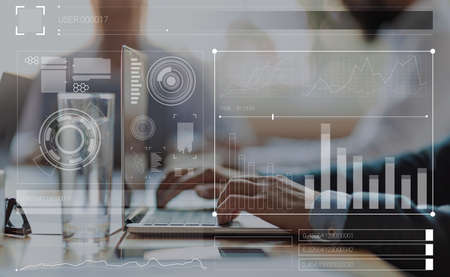
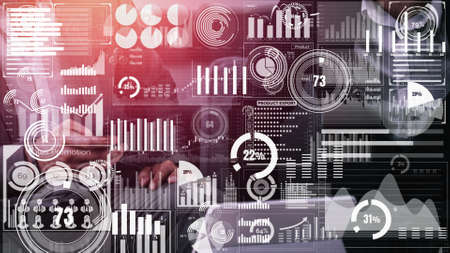
Unleashing Business Insights: Exploring a Virtual Screen with an Interactive Business Intelligence Analyst Dashboard and Spectacular Big Data Graphs and Charts
Коллекция по умолчанию
Коллекция по умолчанию
Создать новую

Financial stock market graph. Stock Exchange. Selective focus.
Коллекция по умолчанию
Коллекция по умолчанию
Создать новую
Financial Analyst Using Convertible Laptop Screen With Graphs
Коллекция по умолчанию
Коллекция по умолчанию
Создать новую
work hard Data Analytics Statistics Information Business Technology
Коллекция по умолчанию
Коллекция по умолчанию
Создать новую
Close-up of a sophisticated data visualization dashboard featuring various graphs and analytics for monitoring performance and trends in real-time.
Коллекция по умолчанию
Коллекция по умолчанию
Создать новую
A laptop computer sits on top of a table, providing a digital workspace for productivity and technology needs, A dynamic website optimized for SEO, AI Generated
Коллекция по умолчанию
Коллекция по умолчанию
Создать новую
A close-up of a bar chart on a smartphone screen, with financial data and trends visible, showcasing the ease of accessing financial information on the go.
Коллекция по умолчанию
Коллекция по умолчанию
Создать новую
Entrepreneur working with a laptop, managing online data, and examining detailed financial charts for business growth
Коллекция по умолчанию
Коллекция по умолчанию
Создать новую
Conceptual business dashboard for financial data analysis . 3D render computer graphic .
Коллекция по умолчанию
Коллекция по умолчанию
Создать новую

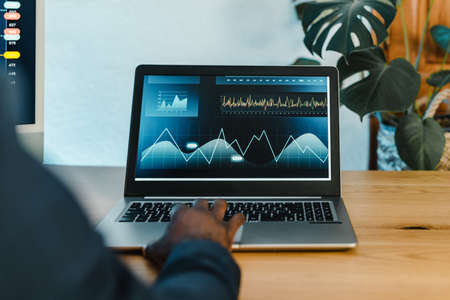
Contemporary workspace highlighting a laptop with data analytics open on the screen, surrounded by plants and office essentials, conveying a productive atmosphere.
Коллекция по умолчанию
Коллекция по умолчанию
Создать новую
A sleek laptop showing detailed financial data analytics with vibrant graphs and charts, set in a bright office, ideal for business and technology presentations.
Коллекция по умолчанию
Коллекция по умолчанию
Создать новую
Business Information Technology people work hard Data Analytics Statistics
Коллекция по умолчанию
Коллекция по умолчанию
Создать новую

Laptop with stock market data on screen, stock market data concept
Коллекция по умолчанию
Коллекция по умолчанию
Создать новую
A close-up of a laptop showing a data analytics dashboard with charts and graphs, ideal for illustrating finance, analytics, and business technology concepts.
Коллекция по умолчанию
Коллекция по умолчанию
Создать новую
Business visual data analyzing technology by creative computer software
Коллекция по умолчанию
Коллекция по умолчанию
Создать новую
digital tablet screen showing a financial charts and graphs with empty note book and pen is on a wooden table
Коллекция по умолчанию
Коллекция по умолчанию
Создать новую
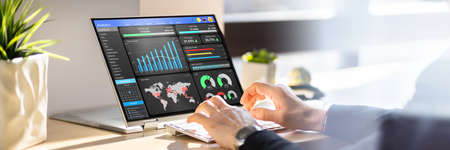
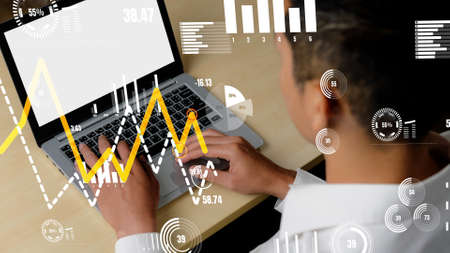
Businessman uses capable laptop computer to analyze business data analytic for marketing strategy and customer relationship management
Коллекция по умолчанию
Коллекция по умолчанию
Создать новую
Laptop with the chart on screen. Business and finance concept
Коллекция по умолчанию
Коллекция по умолчанию
Создать новую

Shallow depth of field (selective focus) with details of a chart showing the stock market crash from March 2020 due to the Covid-19 pandemic on a computer screen (S&P500 index)
Коллекция по умолчанию
Коллекция по умолчанию
Создать новую
High-resolution image of a sleek data dashboard on a computer monitor showcasing financial analysis with various statistical graphs and trends.
Коллекция по умолчанию
Коллекция по умолчанию
Создать новую
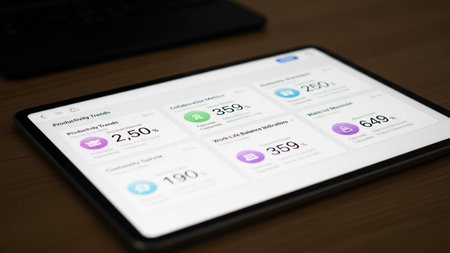
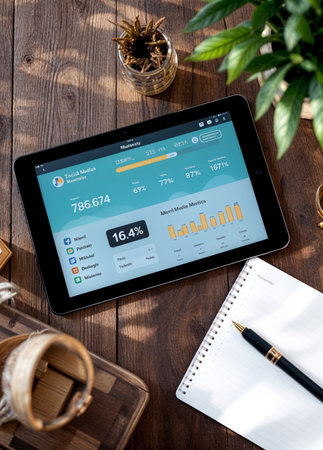
This image shows a tablet device displaying a digital dashboard with various health metrics. The dashboard includes sections for productivity trends, caloric intake, sleep monitoring, work-life balance scores, and step counts. Each section has a visual representation, such as graphs and icons, to provide a clear overview of the user's health and productivity data.
Коллекция по умолчанию
Коллекция по умолчанию
Создать новую
Loading progress bar Load or download and upload circle and speed loader icon. Status or loader progress percentage bar for website or internet page in neon gradient.
Коллекция по умолчанию
Коллекция по умолчанию
Создать новую
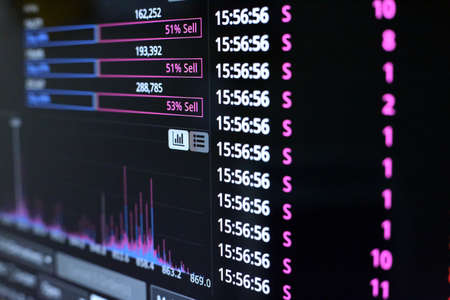
Thailand Stock Exchange, Streaming Trade Screen, The stock screen shows a list of stocks with reduced value.
Коллекция по умолчанию
Коллекция по умолчанию
Создать новую
Conceptual business dashboard for financial data analysis . 3D render computer graphic .
Коллекция по умолчанию
Коллекция по умолчанию
Создать новую

Laptop with financial chart on screen and coffee cup on table in office
Коллекция по умолчанию
Коллекция по умолчанию
Создать новую
A computer screen displaying a plethora of data and information related to key performance indicators, A digital dashboard tracking key performance indicators
Коллекция по умолчанию
Коллекция по умолчанию
Создать новую
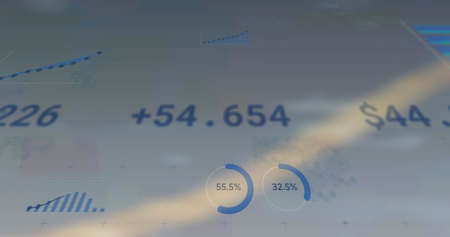
Image of statistics and financial data processing on white background. global business, finances and digital interface concept digitally generated image.
Коллекция по умолчанию
Коллекция по умолчанию
Создать новую
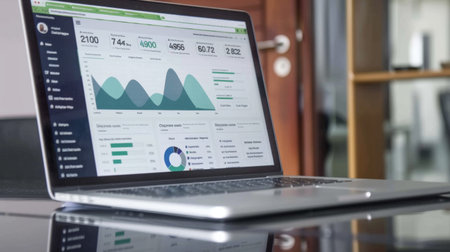
A modern laptop showcases various data visualizations in a bright office setting. The clean layout emphasizes productivity and digital innovation in a professional space.
Коллекция по умолчанию
Коллекция по умолчанию
Создать новую
Intelligence (BI) and business analytics (BA) with key performance indicators (KPI) dashboard concept.business documents on office table with smart phone and digital tablet and graph on wide screen computer.
Коллекция по умолчанию
Коллекция по умолчанию
Создать новую

Business woman reviewing data in financial charts and graphs on wooden desk in office and business working, tax, accounting, statistics and analytic research concept
Коллекция по умолчанию
Коллекция по умолчанию
Создать новую
Closeup of monitor with charts and graphs on screen. Business concept
Коллекция по умолчанию
Коллекция по умолчанию
Создать новую
A sleek and modern workspace featuring a laptop with analytical graphs, a notepad, a coffee cup, and a minimalist design in a bright urban office setting.
Коллекция по умолчанию
Коллекция по умолчанию
Создать новую

A well-organized home office with a laptop displaying financial data, coffee cup, smartphone, and charts on a wooden desk in a bright, inviting space.
Коллекция по умолчанию
Коллекция по умолчанию
Создать новую
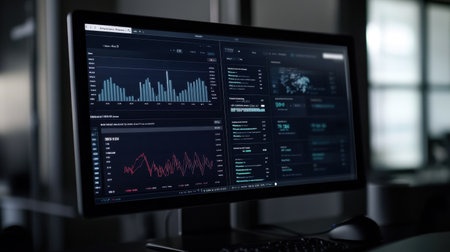
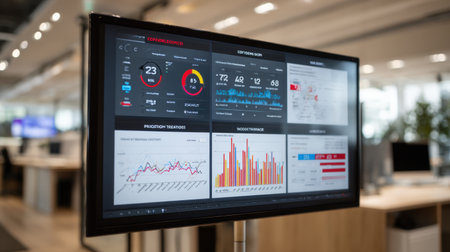
A modern office scene featuring a digital display of business analytics, showcasing various statistical graphs and charts vital for decision-making and strategic planning.
Коллекция по умолчанию
Коллекция по умолчанию
Создать новую
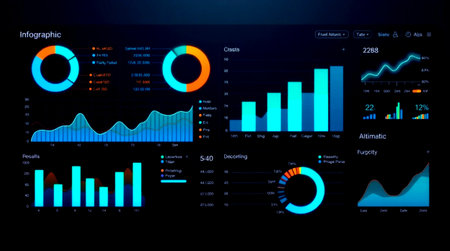
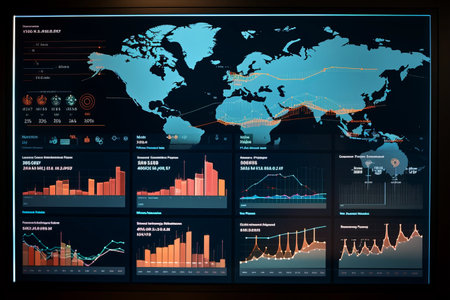
This high-resolution image captures a dynamic digital dashboard showcasing a multitude of intricate data visualizations. Multiple charts, graphs, and indicators present financial performance metrics, market trends, and growth projections in a clear and organized manner. The vibrant colors and detailed graphics emphasize the power of data analytics for informed decision-making in business and technology.
Коллекция по умолчанию
Коллекция по умолчанию
Создать новую
Businessman analyzing investment charts on computer screen in office. Accounting and finance concept
Коллекция по умолчанию
Коллекция по умолчанию
Создать новую
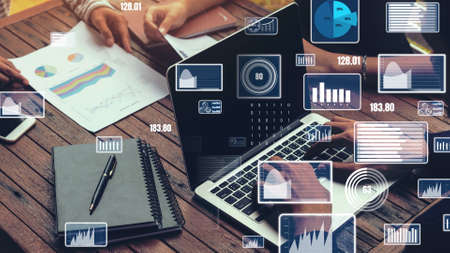
Creative visual of business data analyzing technology . Concept of digital data for marketing analysis and investment decision making .
Коллекция по умолчанию
Коллекция по умолчанию
Создать новую
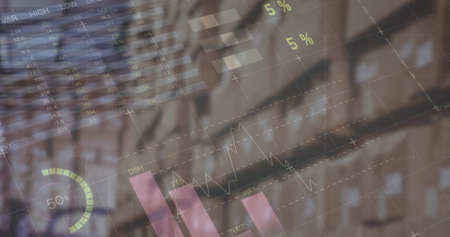
Image of financial data processing over warehouse. global business, delivery, connections and digital interface concept digitally generated image.
Коллекция по умолчанию
Коллекция по умолчанию
Создать новую
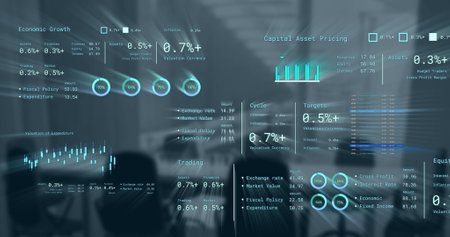
Image of financial data processing over business office. Global networks, business, finances, computing and data processing concept digitally generated image.
Коллекция по умолчанию
Коллекция по умолчанию
Создать новую
KPI Chart Dashboard On 2 In 1 Laptop Screen
Коллекция по умолчанию
Коллекция по умолчанию
Создать новую

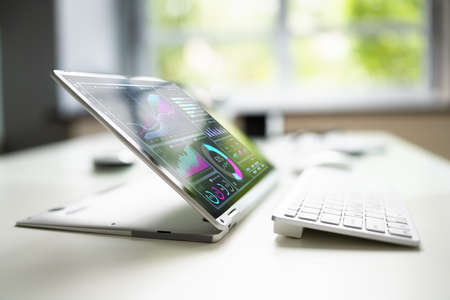
Financial Dashboard Graph On Digital Tablet Or Convertible Laptop
Коллекция по умолчанию
Коллекция по умолчанию
Создать новую
A futuristic digital interface displaying a dual timeline one side illustrating live data analytics with vibrant graphs while the other side visualizes trends from historical data highlightin
Коллекция по умолчанию
Коллекция по умолчанию
Создать новую
Laptop displaying business analytics dashboard with key performance metrics and charts
Коллекция по умолчанию
Коллекция по умолчанию
Создать новую
Businessman uses capable laptop computer to analyze business data analytic for marketing strategy and customer relationship management
Коллекция по умолчанию
Коллекция по умолчанию
Создать новую
A sleek laptop displays vibrant data analysis with graphs and charts, set in a contemporary office. Ideal for showcasing business analytics and insights.
Коллекция по умолчанию
Коллекция по умолчанию
Создать новую

Laptop screen with financial charts and graphs on the table in office
Коллекция по умолчанию
Коллекция по умолчанию
Создать новую
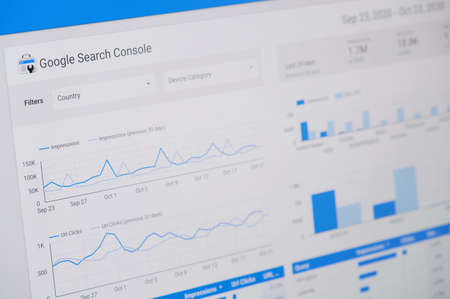
New york, USA - October 23, 2020: Managing google search console screen display close up view
Коллекция по умолчанию
Коллекция по умолчанию
Создать новую

Financial stock market graph. Stock Exchange. Selective focus.
Коллекция по умолчанию
Коллекция по умолчанию
Создать новую
A modern workspace featuring a tablet displaying data analysis surrounded by indoor plants, creating a focus on productivity and innovation in a clean, professional environment.
Коллекция по умолчанию
Коллекция по умолчанию
Создать новую
Business visual data analyzing technology by creative computer software . Concept of digital data for marketing analysis and investment decision making .
Коллекция по умолчанию
Коллекция по умолчанию
Создать новую
Laptop displaying financial data and charts on a desk with a cup of coffee, showcasing business analytics and reporting
Коллекция по умолчанию
Коллекция по умолчанию
Создать новую
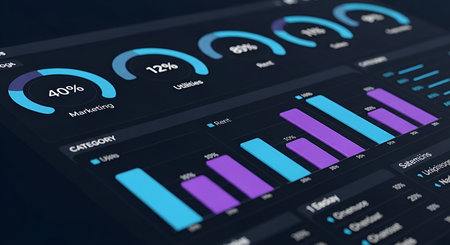
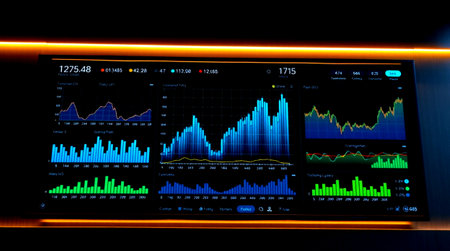
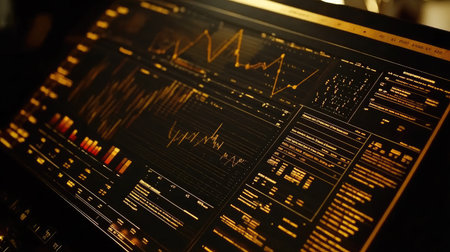
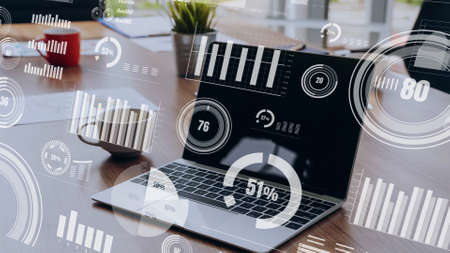
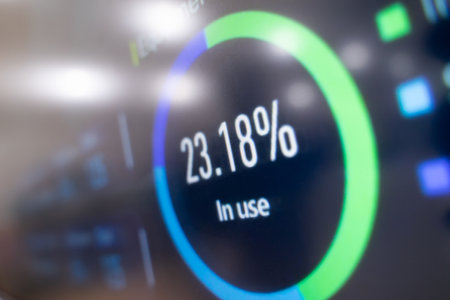
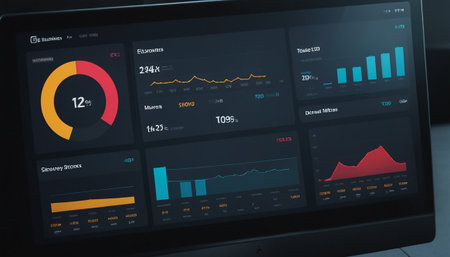
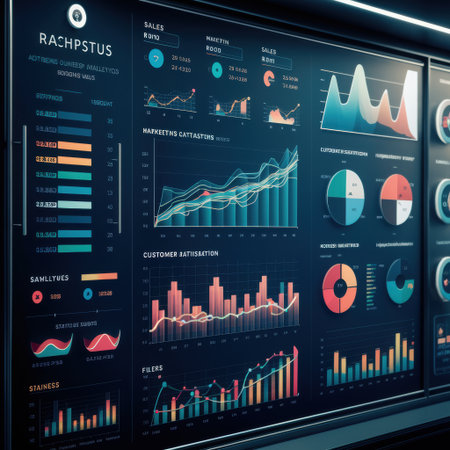
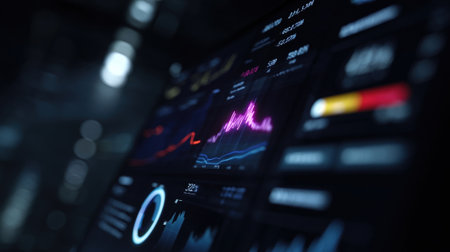
A close-up view of a dark digital dashboard displaying various charts and graphs. Circular progress indicators show percentages like 40% for Marketing and 12% for Utilities. Bar charts, colored in blue and purple, represent data categories such as Rent and Sales. The interface is sleek and modern, suggesting financial or business analysis.
Коллекция по умолчанию
Коллекция по умолчанию
Создать новую
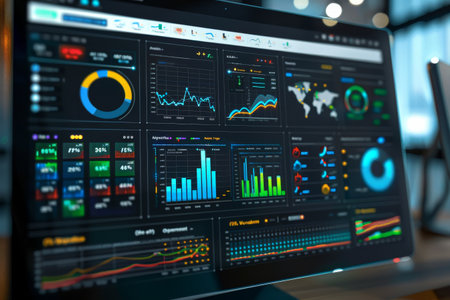
A detailed view of a professional business dashboard showcasing various analytical data on a digital screen in a contemporary office setting, perfect for presentations.
Коллекция по умолчанию
Коллекция по умолчанию
Создать новую
A laptop showcases a dynamic business analytics interface with colorful graphs and charts in a modern office setting, emphasizing data-driven decision-making.
Коллекция по умолчанию
Коллекция по умолчанию
Создать новую
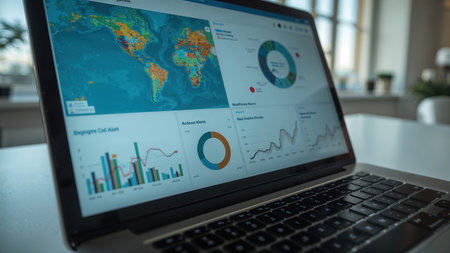
Open laptop showing a data analytics dashboard with visualizations including charts, graphs, and a world map. Bright office background with natural light.
Коллекция по умолчанию
Коллекция по умолчанию
Создать новую
Crop black businessman typing on laptop
Коллекция по умолчанию
Коллекция по умолчанию
Создать новую
Conceptual business dashboard for financial data analysis . 3D render computer graphic .
Коллекция по умолчанию
Коллекция по умолчанию
Создать новую
A sleek laptop showcasing a detailed business analytics dashboard filled with graphs and charts, set in a stylish office environment emphasizing modern workspace trends.
Коллекция по умолчанию
Коллекция по умолчанию
Создать новую
A laptop computer sits on top of a wooden desk in a simple and organized workspace, A cutting-edge digital marketing tool designed to revolutionize customer engagement
Коллекция по умолчанию
Коллекция по умолчанию
Создать новую
Laptop displaying graphs and charts sits on a desk, reflecting the surrounding office environment
Коллекция по умолчанию
Коллекция по умолчанию
Создать новую

This display features a dynamic dashboard presenting various financial data visualizations, including graphs and performance metrics. The vibrant colors enhance the analytical insights.
Коллекция по умолчанию
Коллекция по умолчанию
Создать новую
A close-up of hands holding a smartphone with a banking app, showing a financial graph of account balances and transactions.
Коллекция по умолчанию
Коллекция по умолчанию
Создать новую
Legion-Media
Создайте свои проекты на основе качественных стоковых фотографий и видео.


Copyright © Legion-Media.